On this page, I would like to give you some free download files about aircraft.
I made these files for the fun or for my own studies. If it could help you ...Here it is !

There are several Matlab functions:


Artificial Horizon instrument Display : "functionDisplay.m" Matlab function
HorizonArtificiel
  • Language: Matlab function
  • Inputs:
    • Pitch angle (radians) - Assiette
    • Bank angle (radians) - Gîte
    • Altitude (meters) - Altitude
    • True Air Speed (m/s) - TAS
    To call the function, you have to do (for example):
    	Gite     = -15*pi/180;   % radians 
    	Assiette = 10*pi/180;    % radians
    	altitude = 33000*0.3048; % m
    	TAS      = 240;          % m/s
    	SimulateurInitialisation
    	displaymodifie=functionDisplay(Assiette,Gite,altitude,TAS)
  • Outputs: As you can see on the chart at the left, the output is a figure (with its handle properties) in which the Artificial Horizon is drawn at the flight position that you specified.
  • What does this function do? This function draws the Artificial Horizon on Matlab figure. Altitude is indicated in feet on the right. True Air Speed (kt) is shown on the left.
  • How does this function do it? It uses the Matlab function "patch" and its handle properties.
  • Why does this function do it? I did it for the fun, but it could be used in output simulator... Some improvements should be done with the display of Course angle and Vertical speed Vz.

download it for free


Dessine-moi un avion... : "DessineMoiUnB747.m" Matlab function
B747 
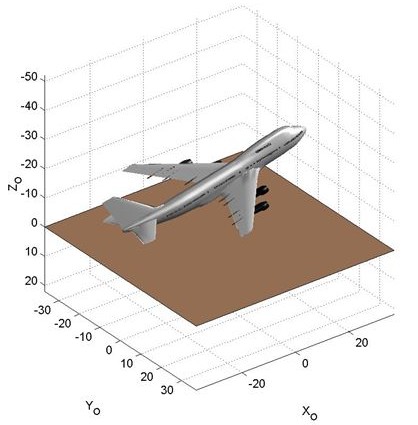
Would you like to draw an aircraft in 3 dimensions with Matlab ? I give you this oportunity with the "DessineMoiUnB747.m" function. This allows you to draw a B747 in three dimensions in accordance with the inputs you gave: course angle, pitch angle, bank angle, altitude.
  • Language: Matlab function
  • Inputs:
    • Course angle (radians) - Cap
    • Pitch angle (radians) - Assiette
    • Bank angle (radians) - Gîte
    • Altitude (meters) - Altitude
    To call the function, you have to do (for example):
    	Gite = -5 *pi/180; 
    	Assiette = 12 *pi/180;
    	Cap = 0 *pi/180;
    	altitude = 15;
    	DessineMoiUnB747(Cap,Assiette,Gite,altitude)
  • Outputs: As you can see on the chart at the left, the output is a figure (with its handle properties) in which the B747 is drawn at the flight position that you specified.
  • What does this function do? This function draws a B747 in a 3D Matlab figure.
  • How does this function do it? It uses the Matlab function "patch('Vertices',vertices,'Faces',faces)" to draw the B747. Rotation matrices allow to put the B747 on the flight attitude you want.
  • Why does this function do it? This function can be used to illustrate some reports; to show airplane in a specific flight attitude.
    This function can be used to make flight dynamics animations. For example, it could be usefull to show to the students how the airplane moves in dutch roll, or during a phugoïd... You only have to give the angles and altitude evolution (from solving dynamic of flight equations) to the function DessineMoiUnB747.m, and you could watch the airplane moves.
    
    		% Example to make the airplane moves
    		for(i=[0:1:15 15:-1:0]),
    			clf,
    			DessineMoiUnB747(0,i*pi/180,0,37);
    			pause(0.0001)
    		end
    		

download it for free


UIUC Airfoil data importation : "functionReadAirfoilData.m" Matlab function
Airfoil UIUC
  • Language: Matlab function
  • Inputs: Airfoil definition data file (it only reads the Lednicer format files) that you can download from Michael Selig's web site (UIUC). The Input is the name file you want to study. To call the function, you have to do (for example):
    		file='b737a.dat';
    		Data = functionReadAirfoilData(file);
  • Outputs: The produced Output is a matlab structure:
    % Data.title           = 'BOEING 737 ROOT AIRFOIL' % first file line: airfoil name
    % Data.x_upper         = [23x1 double]   % undimensionless upper airfoil abscisse.
    % Data.y_upper         = [23x1 double]   % undimensionless upper airfoil data: 
    %                                        % y_upper = y_upper(x_upper)
    % Data.x_lower         = [23x1 double]   % undimensionless lower airfoil abscisse.
    % Data.y_lower         = [23x1 double]   % undimensionless lower airfoil data: 
    %                                        % y_lower = y_lower(x_lower)
    % Data.thickness_chord = 0.1537          % determined by splining
  • What does this function do? This function allows you to import airfoil definition from UIUC web site.
  • How does this function do it? It uses the Matlab function 'fopen' and creates a structure in output.
  • Why does this function do it? This function can be used to work on profils studies with matlab (to determine profils characteristics, Cmo, Cza, ...). For example, to plot the profil you have to do:
    % If you want to plot airfoil, do:
    		figure(1)
    		hold on,
    		plot(Data.x_upper,Data.y_upper)
    		plot(Data.x_lower,Data.y_lower)
    		axis([0 1 -0.5 0.5])
    		title(Data.title)

download it for free


Matlab plot with several X or Y axes : "PlotMultiAxes.m" Matlab function
plotMultiAxes
  • Language: Matlab function
  • Inputs: The user has to give the X and Y axes properties
     - Main Axes MA
        Compulsory inputs:
            MA.x                = [vector of the x data];
            MA.y                = [vector of the y data: y=y(x)];
        Optional inputs: (default values shown here)
            MA.Labelx           = ' ';       % X-axis label
            MA.Labely           = ' ';       % Y-axis label
            MA.Titre            = ' ';       % Title of the figure 
            MA.Color            = 'b';       % curve line color
            MA.LineStyle        = '-';       % Line style (solid, dotted, dashdot, dashed,...)
            MA.LineWidth        = [0.5];     % Line width
            MA.Marker           = 'none';    % Marker type (+ . o ^ v or x)
            MA.MarkerSize       = 6;         % Marker size
            MA.MarkerEdgeColor  = 'auto';    % Marker edge color
            MA.MarkerFaceColor  = 'none';    % Marker face color
            MA.Axis             = [];        % sets scaling for the x- and y-axes on the current plot
     - Auxiliary Axes AA
        Compulsory inputs:
            AA.Vecteur          = [Data corresponding to MA.x or MA.y];
            AA.Nature           = 1 ou 2;    % for x- or y- axis
        Optional inputs: (default values shown here)
            AA.Distance         = 15;        % axis position (in % of the figure height)
            AA.Format           = 2;         % graduation: 1=linear, 2=automatic
            AA.Label            = ' ';
    To call the function, you have to do (for example):
            clear all, close all
            MA.x                = [60:5:160];
            MA.y                = -0.01*(MA.x*1000/60/60-30).^2+10;
            MA.Labelx           = 'Speed: /bf V (km/h)';
            MA.Labely           = 'Vertical speed: /bf Vz (m/s)';
            MA.Titre            = '/bf Test of the function "plotMultiAxes"';
            MA.Axis             = ([60 160 7 10]);
            AA(1).Vecteur       = MA.x*1000/60/60;
            AA(1).Nature        = 1;         % auxiliary x-axis
            AA(1).Label         = 'Speed: /bf V (m/s)';
            AA(2).Vecteur       = 3000*9.81./(0.5*1.225*70*(MA.x*1000/60/60).^2);
            AA(2).Nature        = 1;         % auxiliary x-axis
            AA(2).Label         = 'Lift coefficient: /bf C_L';
            AA(3).Vecteur       = MA.y*60/0.3048;
            AA(3).Nature        = 2;         % auxiliary y-axis
            AA(3).Label         = 'Vertical speed: /bf Vz (ft/min)';
            AA(3).Distance      = 85;
            plotMultiAxes(MA,AA);
  • Outputs: The produced Output is a matlab figure with its handle properties (as done by h=plot(MA.x,MA.y)).
    For example, in order to change the color line of the curve (red color), the user can do: set(h,'Color','r')
  • What does this function do? This function allows you to draw matlab plots with several x- or y-axes (more sophisticated than the plotyy Matlab function).
  • How does this function do it? It uses the Matlab function 'plot' and some 'text' properties.
  • Why does this function do it? This function can be used to show plots with different units, ...

download it for free
and download the user manual